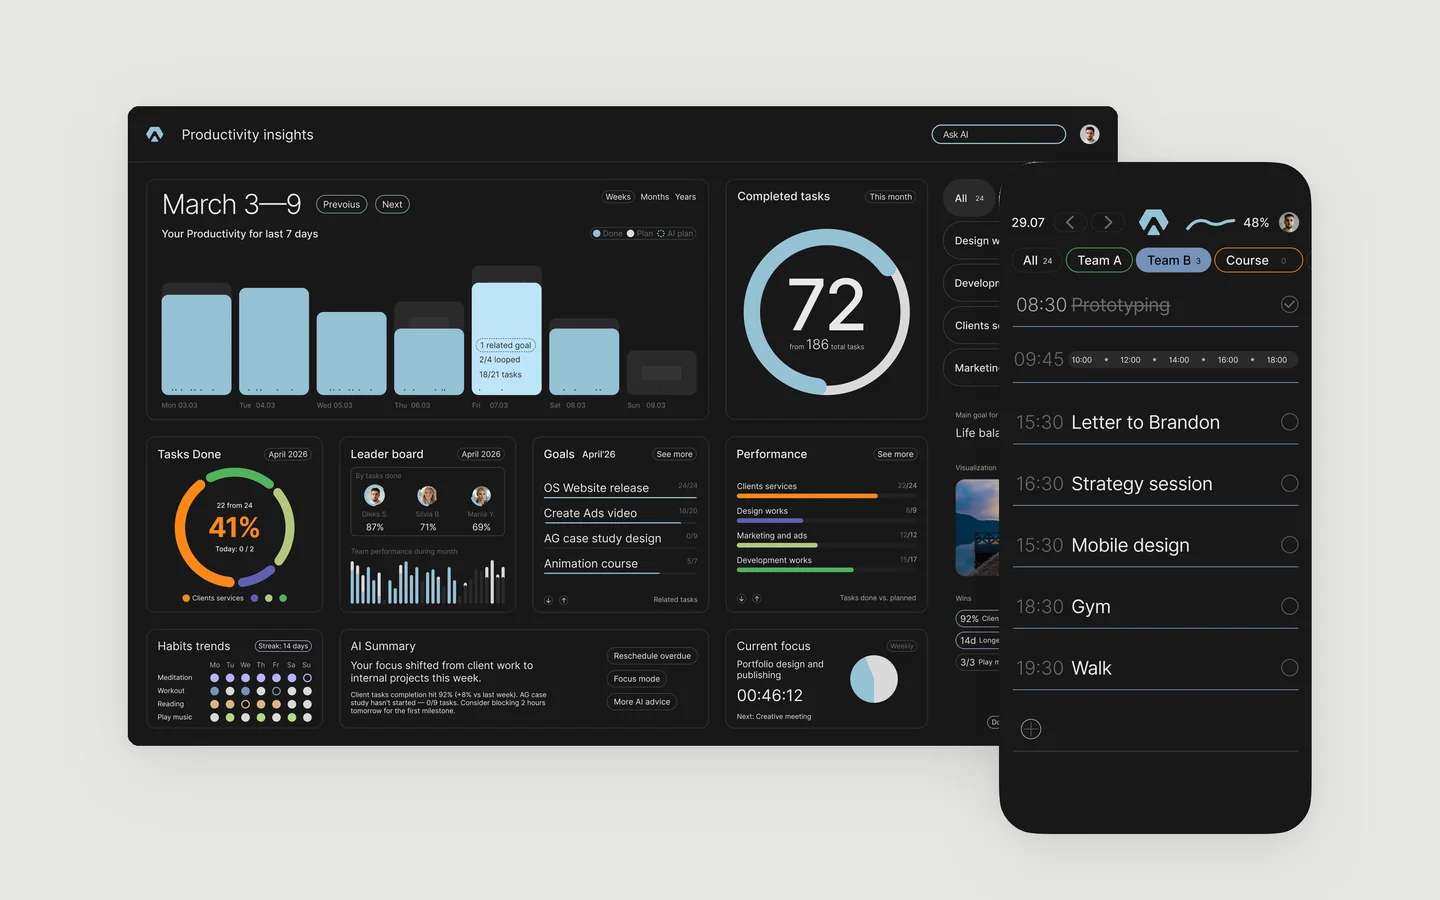
A sales dashboard for a design studio
A studio can design beautiful products and still not know where its next client comes from. Our leads arrived from several places, every manager kept their own notes, and on Friday nobody could say whether the week went well. So we designed a dashboard for ourselves, the same way we design them for clients.
Start from one question
Every good dashboard answers one question before anything else. Ours is simple. Are we on plan this week?
That question decides the first screen. It opens on the current week, shows the number of new leads in large type, and colours the plan card green, yellow or red. Everything else waits one step lower on the page.
Count the funnel, not the activity
Sent messages and hours online feel like progress, but they do not pay the bills. We count the steps a client actually takes:
- Lead. Someone asked about a project, or answered our message.
- Proposal. We sent a scope and an approach.
- Dialog. The client wrote back.
- Call. We spoke.
- Contract. Work started.
With twenty leads a week, a healthy studio turns about a quarter of them into dialogs and one or two into contracts. The funnel shows at a glance which step leaks.
A plan with two lines
A single target either scares people or bores them. So every person and the whole studio have two lines, a minimum and a maximum. Below the minimum the card turns red. Between the lines it is yellow. Above the maximum it is green. Nobody needs to read a number to know how the week is going.
People and channels in the same view
The managers table shows the same funnel for each person, so a manager with many leads and few dialogs sees it before the month is gone. The channels table splits inbound from outbound. A marketplace, ads and referrals bring people who already want something. Outbound brings people who did not ask yet. They convert differently, and mixing them hides both.
For the ads channel we keep a small card with clicks, click rate and leads for the month, so the cost of a lead can be checked against the contracts it brought.
What it looks like
Here is the same layout filled with a sample month of a New York studio with five managers.
| Name | Leads | Proposals | Dialogs | Calls | Contracts |
|---|---|---|---|---|---|
| Sasha | 21 | 16 | 7 | 4 | 1 |
| Karina | 18 | 13 | 5 | 3 | 1 |
| Stacy | 17 | 12 | 4 | 2 | 1 |
| Jordan | 15 | 11 | 4 | 2 | 1 |
| Daniel | 13 | 9 | 3 | 1 | 0 |
| Total | 84 | 61 | 23 | 12 | 4 |
| Channel | Leads | Dialogs | Contracts |
|---|---|---|---|
| Inbound | |||
| Channel 1 | 32 | 9 | 2 |
| Channel 2 | 18 | 5 | 1 |
| Channel 3 | 9 | 4 | 1 |
| Outbound | |||
| Channel 4 | 15 | 3 | 0 |
| Channel 5 | 10 | 2 | 0 |
Figures are illustrative. The studio, names and numbers are made up to show the layout.
Built for the phone first
Managers check the numbers between calls, mostly on a phone. On a small screen the cards stack, the key figures stay large, and the tables scroll sideways instead of shrinking the type. Every Monday each person also gets a short email with their week as one picture, so nobody has to open the dashboard to know where they stand.
A dashboard for your team
The same approach works for any team that sells: an agency, a clinic, a SaaS company with a sales team. One question first, a funnel instead of activity, a plan with two lines, and a layout that works on a phone. If your numbers live in five places, let’s discuss how one screen could hold them. More about our work on SaaS dashboards.